Aerial drones, crowds of folks gathering soil samples and new analysis techniques combine as pieces in digital maps that improve crop yields on African farms. The Africa Soil Information Service is a mapping effort halfway through its 15-year timeline. Its goal is to publish dynamic digital maps of all of Sub-Saharan Africa at a resolution high enough to serve farmers with small plots. The maps will be dynamic because AfSIS is training people now to continue the work and update the maps.
Why soil maps?
African farms produce fewer crops than they could. Much of that potential could be met by choosing the best crops for each region and by adding the right ingredients to the soil, including water and fertilizers. Soil maps can tell a farmer what the land needs to thrive.
Maps can also pinpoint problem areas such as the likely sources of soil erosion. Traditional maps available tend to be incomplete, static and of a low resolution that is not useful to farmers with small plots.
Traditional maps available tend to be incomplete, static and of a low resolution that is not useful to farmers with small plots.
“We’re working to create fully reproducible and cheap maps for all of Sub-Saharan Africa,” says Swetha Ramaswamy the education coordinator for AfSIS. “We have 250 x 250 meter-resolution maps for the entire continent, so we have a good idea of where the agriculture is. These are pretty high-resolution maps of most of the indicators that people would be interested in.” And AfSIS plans to improve the resolution before it concludes.
“Now we’re working to build out capacity in different areas to make sure that the processes we’re developing don’t die at the end of the program,” Ms. Ramaswamy says.

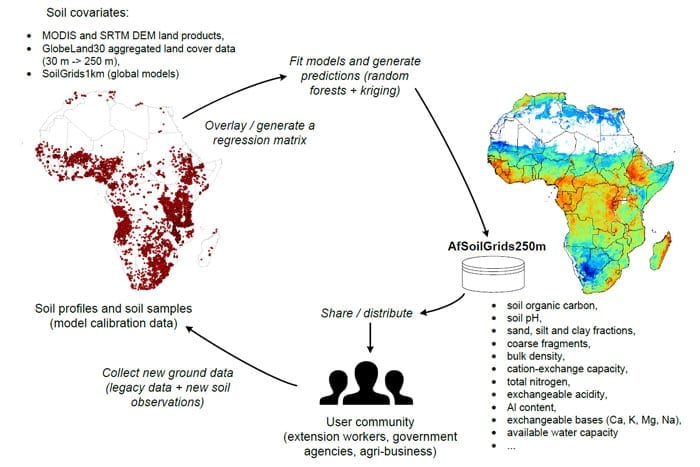
The AfSIS partner ISRIC World Soil Information has published free-of-charge soil maps of Africa at 250 meter resolution.
Cheaper soil testing with spectroscopy
The tools that AfSIS is developing have dramatically cut the cost of the work. The key cost-cutting technology is infrared spectroscopy, which observes the way that a soil sample reflects light. Keith Shepherd at the World Agroforestry Centre in Nairobi, Kenya, and a partner of AfSIS explains.
“It sounds complicated, but it’s actually pretty simple. Basically, what we do is shine light on a soil or plant sample and measure the amount of light reflected back at different wavelengths or energy levels, much in the same way that a digital camera records color. The spectral signature, or fingerprint, tells us about the sample’s mineral and organic composition. These characteristics determine a soil’s functional capacity – for example its ability to retain and supply water and nutrients and to store carbon. With that information, we can then determine the soil’s potential and make highly accurate recommendations about what farmers need to do to improve the health of their soils and produce better crops.”
Drones, satellites and crowds
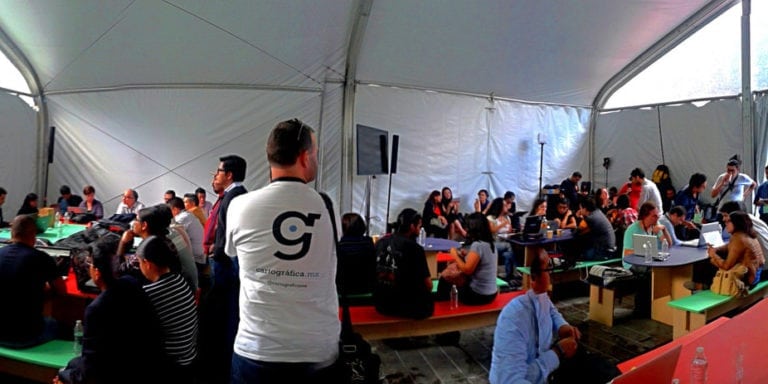
AfSIS collects satellite images and gathers its own data using aerial drones and soil samples brought in by field technicians and volunteers. They combine the new information with legacy maps housed in digital databases and on paper.
“Most maps are done in pen and paper and made in the ‘80s and ‘90s. Most of the spatial mapping data is not digital,” Ms. Ramaswamy says.
“The amount of info that’s out there that people just don’t know about or how to access is tremendous. It’s terrifying and esxciting. We’re working to turn it into something people can use” – Swetha Ramaswamy
Mobile data gathering tools such as Open Data Kit help coordinate the crowd of helpers. And fixed-wing Ebee drones provide soil data through their mounted near-infrared spectroscopes.
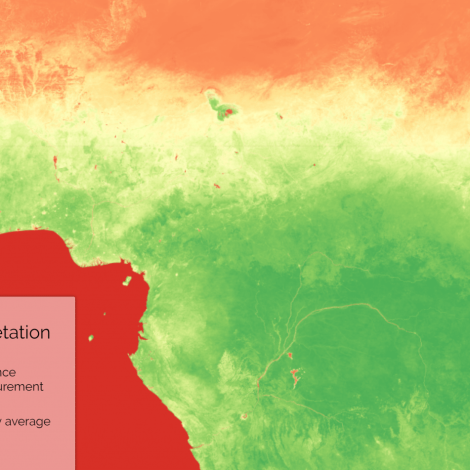
“A lot of people know about vegetation mapping in general, but we’re one of the few organizations to incorporate it into a work stream. We’re not just using info directly from the drones, we’re trying to expand it and see what more we get out of it,” Ms. Ramaswamy says. “Without ever having to visit a location, we can assess how healthy the vegetation is, or how dense it is.”
Fill in the gaps with statistical models
AfSIS is creating statistical models that can predict information about a piece of land based on samples taken from small spots around it. With these algorithmic estimates, the organization fills in gaps that have not been tested and builds complete geospatial maps.
Always up to date, free and open source
The maps are freely available now and the goal is that they will always be up to date, even after AfSIS concludes its project.
“We update all of our input layers quarterly and that needs to be incorporated in the maps. Building out maps for specific regions is important. Tanzania has an area that they’re trying to intensify and off-the-shelf products aren’t good enough for that. We’re training them to use our process to develop their own maps,” Ms. Ramaswamy says.
The maps as well as the tools needed to build them are freely available online. By project’s end, those tools will include the statistical models that AfSIS is developing as well as information about AfSIS’ sampling protocol, drone code and more. Please find information below.

